Business app
The Business app empowers a merchandiser to manage exposure strategies, boost or bury products, and conduct A/B-tests effortlessly. It also provides access to panel performance reports and swift insights into sales sources for a market segmented based on conversions, revenue, and profit.
Disclaimer
App design and features are subject to change without notice. Screenshots, including simulated data visible, are for illustrative purposes only.
Dashboard
The Dashboard tab gives quick access to metrics such as sessions, orders, and sold units. It includes graphs for conversions, revenue, and profit as well as the origins of those metrics.
The data on the dashboard is displayed per market over a period of time that can be either daily, weekly, monthly, or a custom interval.
| Metric | Description |
|---|---|
| Sessions | The number of active visitor sessions during the set period of time. |
| Orders | The number of orders that have been completed and notified with Payment notification (Web API v1, Web API v2) or Secure payment notification (Web API v1, Web API v2) during the set period of time. An order can include one or more products. |
| Sold units | The number of sold products in the orders during the set period of time. |
| Conversions | The number of sessions where at least one order have been completed and notified with Payment notification (Web API v1, Web API v2) or Secure payment notification (Web API v1, Web API v2) during the set period of time. |
| Revenue | The revenue of the sold products during the set period of time. Revenue can only be calculated when using Payment notification (Web API v1, Web API v2) or Secure payment notification (Web API v1, Web API v2), and including the parameter sellingPrice in the notification. |
| Profit | The profit of the sold products during the set period of time. Profit can only be calculated when using Secure payment notification (Web API v1, Web API v2), and including the parameters sellingPrice and cost in the notification. |
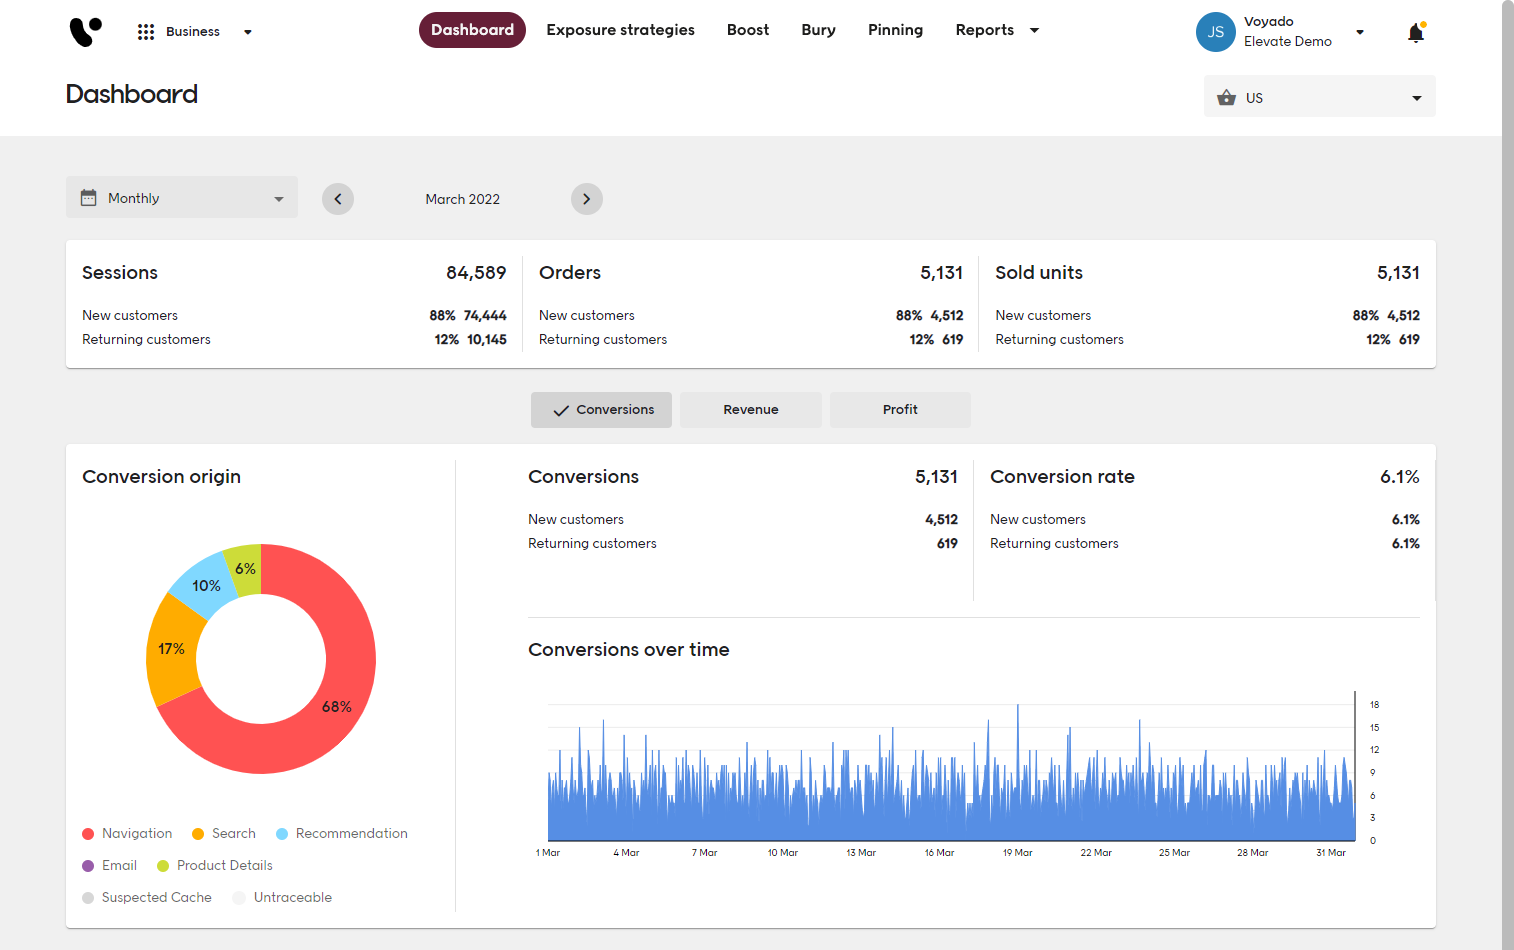
Conversion origin
The origin of a conversion is determined by the first interaction a visitor have with the purchased product. The origins grouped by Navigation, Search, Recommendations, Ads, Email, Product details, Elevate other, Non Elevate, Suspected cache, and Untraceable. The interactions are tracked with the use of Notifications.
If a product is purchased through a search result (Search), but the first interaction was a click on the product on a category page (Navigation), the conversion origin will be attributed to Navigation. The conversion, as well as all the revenue and profit of that purchase, will be attributed to Navigation. A conversion can include multiple products, hence one conversion can originate from more than one place.
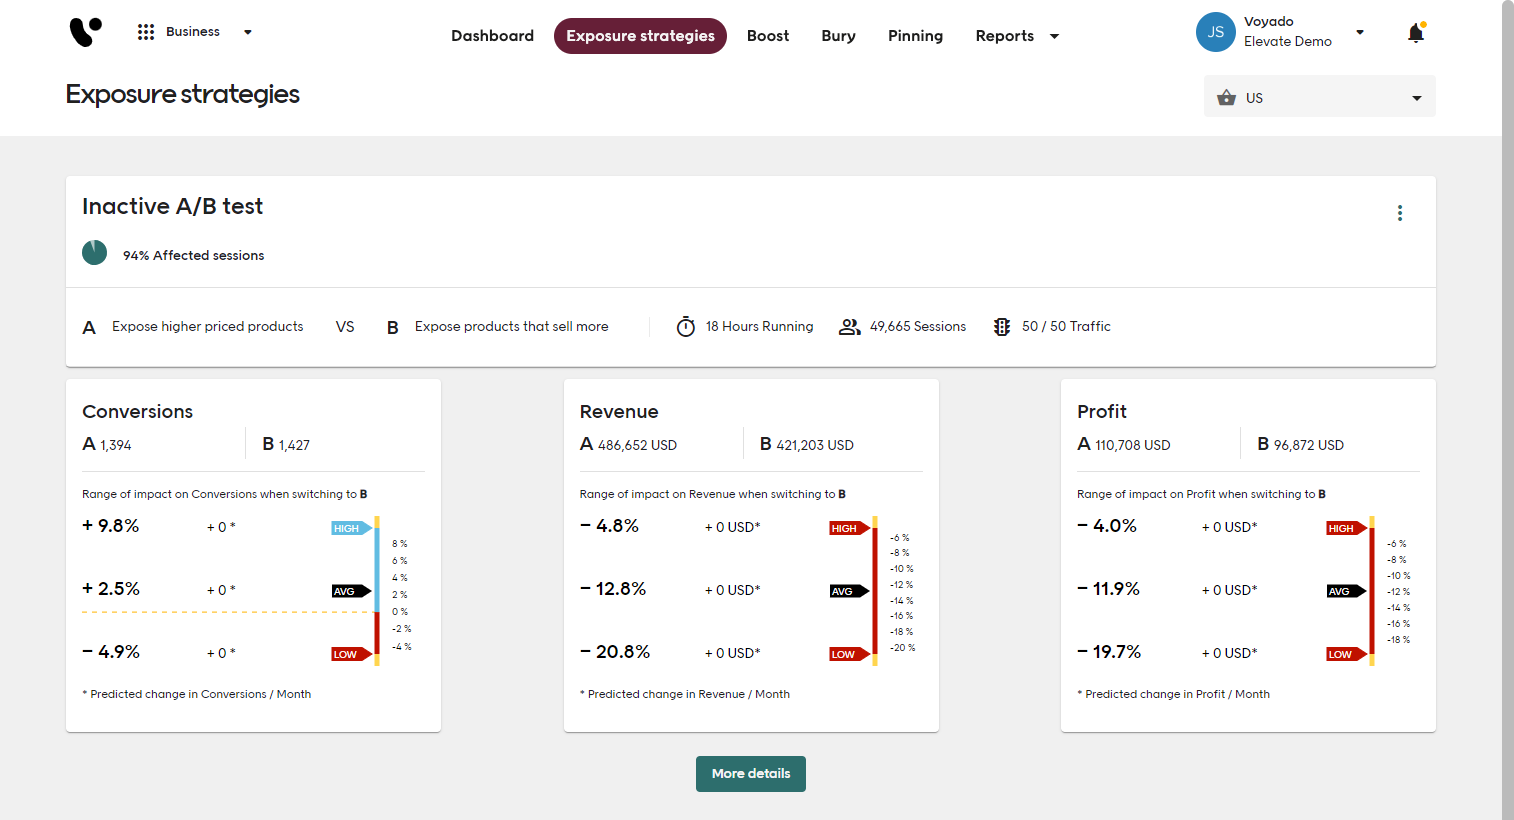
Exposure strategies
Exposure strategies is a concept that enables merchandisers to have Voyado Elevate optimise its algorithms for product exposure towards different business goals. Three different exposure strategies are available, and A/B testing can be performed between two strategies. Exposure strategies include a step-by-step guide on how to set up and get started with testing.
Before selecting an exposure strategy it is recommended to perform an A/B test between the strategies. An A/B test will establish the effect of switching exposure strategy on a site.
The site traffic is split into 2 equal groups, each facing one of the evaluated strategies. Approximately 10,000 sessions is needed before any data is visible. Dependent on site traffic, this takes between a few hours and a few days.
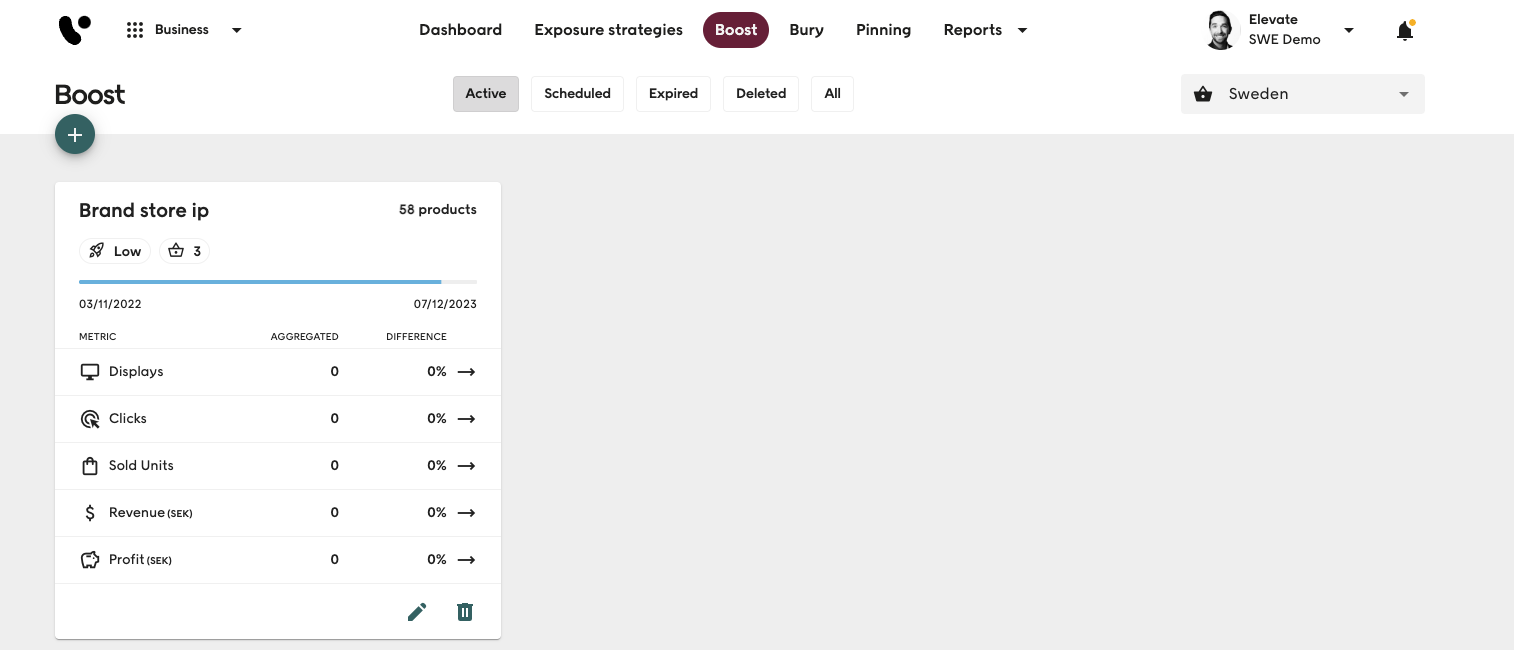
Boost
Boosting is a method to temporarily enhance the strategy score of selected products and variants in one or more markets. It's valuable for scenarios like boosting upcoming external campaigns, clearing stock of specific products, or boosting certain brands or types of products. Boosted products will secure higher positions in search results, category pages, and other areas where boosts are supported.
Products are either manually selected or determined by rules that encompass product inclusion or exclusion based on their attributes and values. Statistics for boosts are collected and can be compared to sessions without boosts.
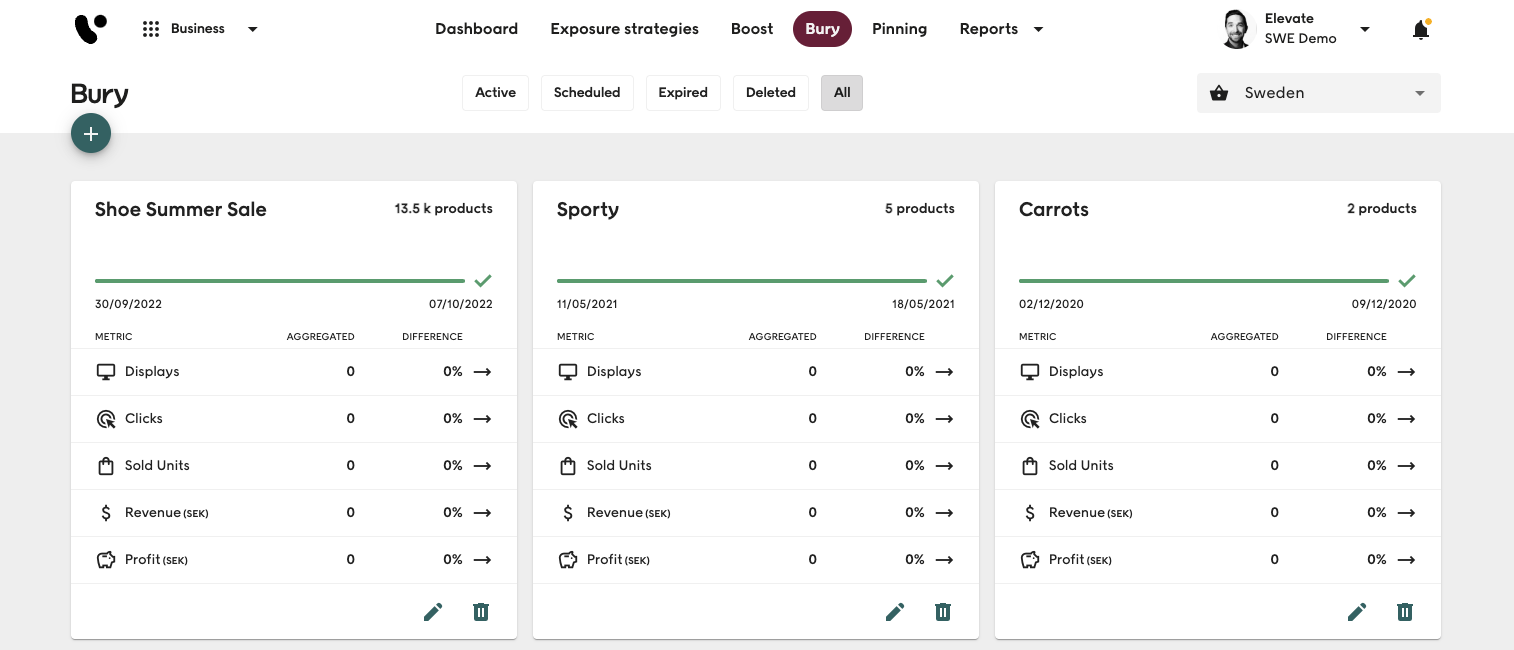
Bury
Burying s a method to temporarily lower the strategy score of selected products and variants in one or more markets. It is useful for use cases such as reducing the visibility of seasonal products when their season ends or decreasing the prominence of certain brands or types of products. Hidden products will have reduced positions in search results, category pages, and other locations where reductions are supported.
Products are either manually chosen or selected by rules that include or exclude products based on their attributes and values. Statistics when using bury are collected and can be compared against sessions not utilizing the bury.
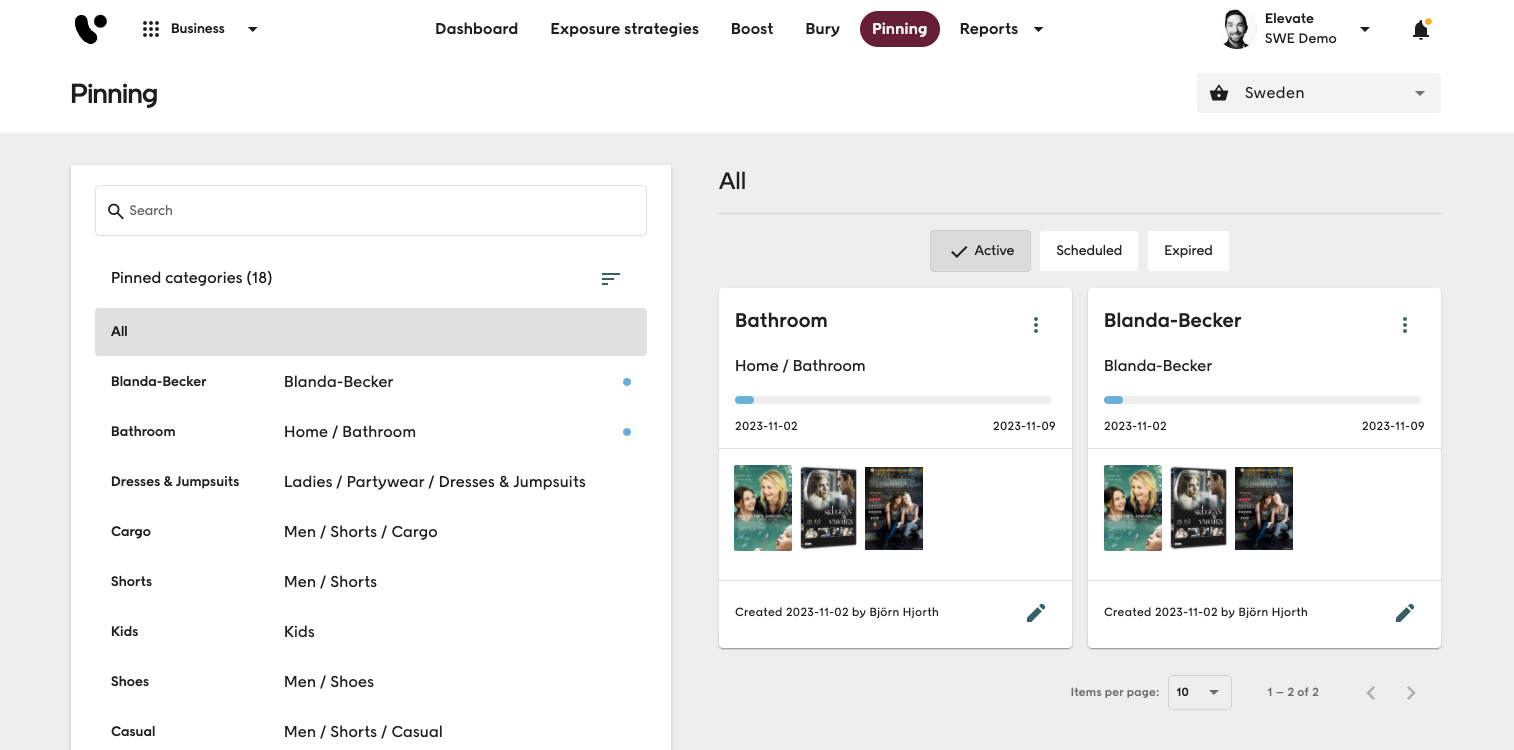
Pinning
Pinning is a feature that allows a merchandiser to manually pick and order products for the top positions in the Product list panel and the Product list with count zone. It enables merchandisers to contribute their valuable external insights, applying granular control per category on top of the automated relevance.
Reports
The Reports tab include two report types, the Panel report and the Panel summary report.
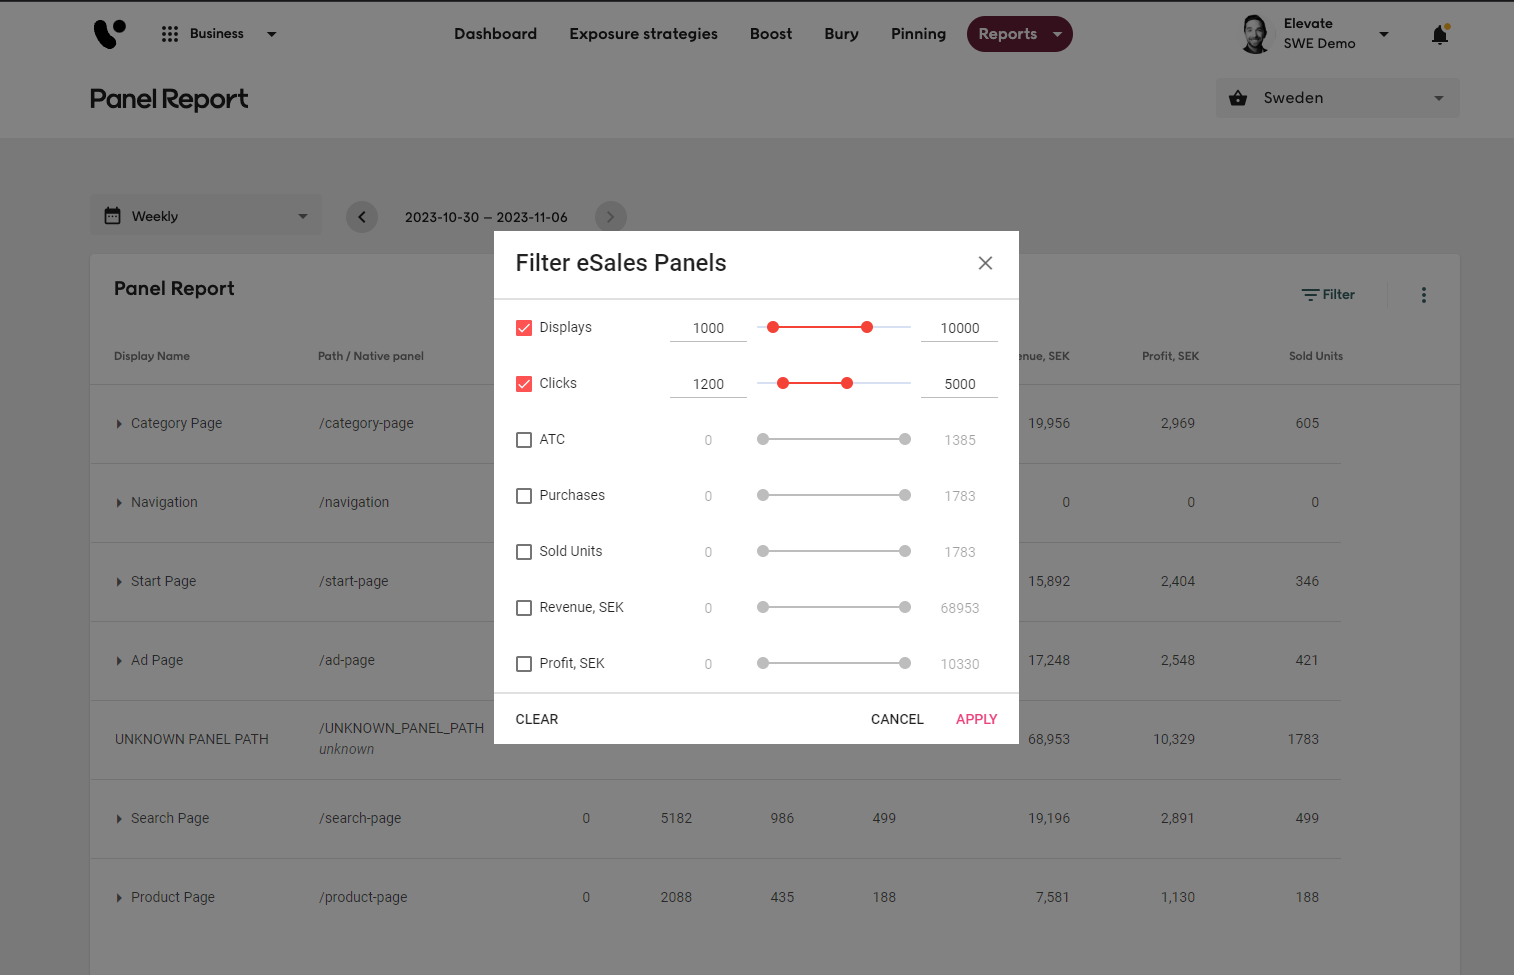
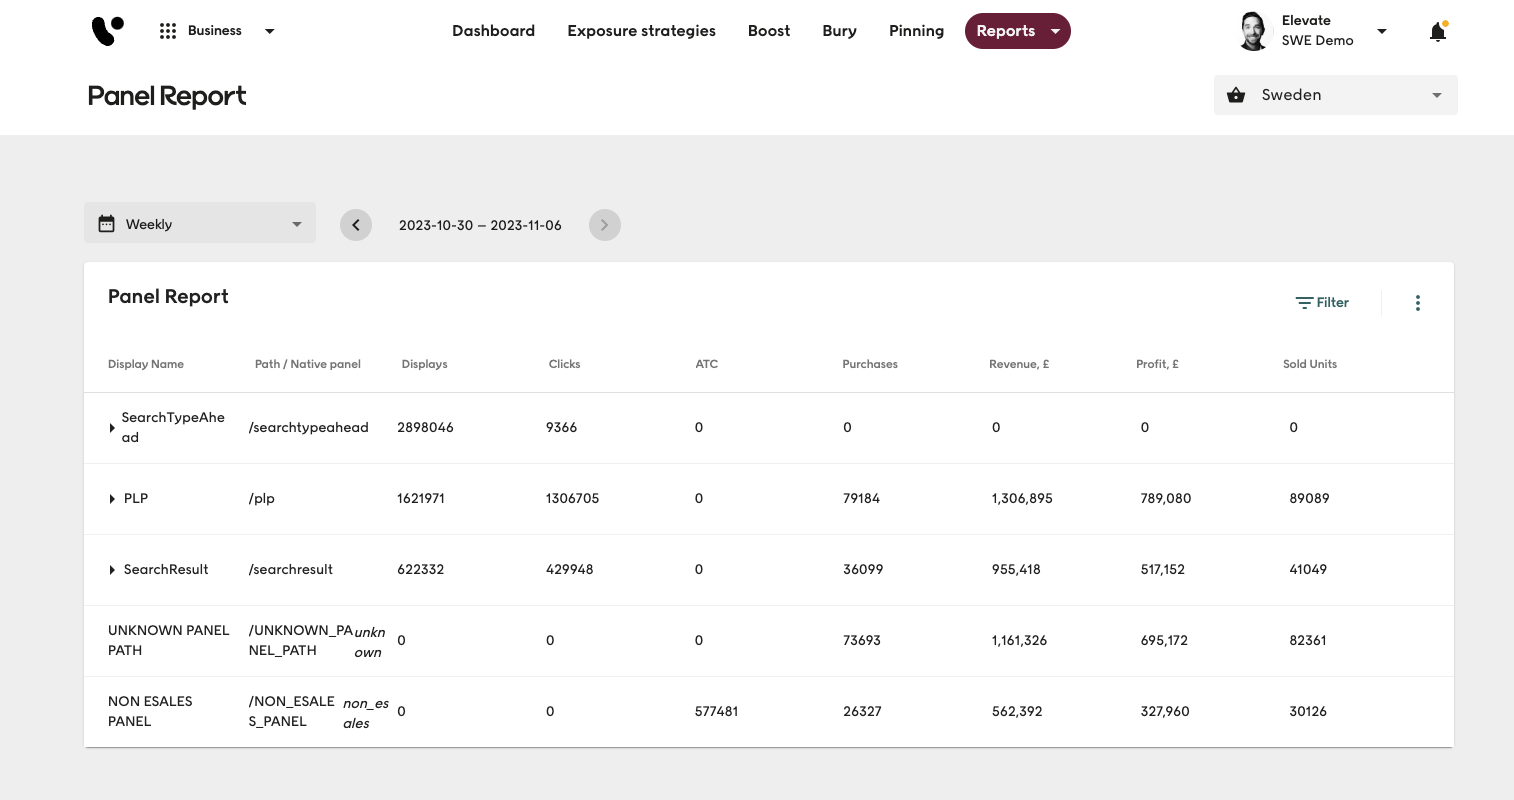
Panel report
The panel report display a list of all pages, zones, and panels configured in Elevate and their performance statistics in a market. This can be used to see how well a page type or a specific panel performs on the site. If a page or a panel is not performing well this is an indication that a change of the panel or the page can be needed.
Each page and zone can be expanded to show the individual panels and their paths and statistics. Revenue and profit are displayed in the currency of the active market. The following statistics are available.
| Statistic | Description |
|---|---|
| Displays | The number of displays of the page, zone, or panel on the site. |
| Clicks | The number of clicks on products on a page, zone, or panel. |
| ATC | Add to cart, the number of times products has been placed in a cart from the page, zone, or panel. |
| Purchases | The number of purchases generated from the page, zone, or panel. |
| Revenue | Total revenue generated from the page, zone, or panel. |
| Profit | Total profit generated from the for the page, zone, or panel. Requires notification on product cost. |
| Sold units | Total number of sold units for the page, zone, or panel. |
Pages, zones, and panels can be both sorted and filtered based on the statistics. The panel report can also be exported and downloaded as a .csv-file.

Panel summary report
The panel summary report display aggregated statistics for each type of predefined panel in a market. The predefined panel types are grouped by conversion origin. A total for all predefined panel types within each conversion origin is also displayed.
Revenue and profit are displayed in the currency of the active market. The following statistics are available.
| Statistic | Description |
|---|---|
| Name | The name of the predefined panel type/conversion origin. |
| Sold units % | The percentage of sold units attributed to the predefined panel type. |
| Sold units | Then number of sold units attributed to the predefined panel type. |
| Rev % | The percentage of revenue attributed to the predefined panel type. |
| Rev | The revenue attributed to the predefined panel type. |
| Rev/Sold unit | The revenue per sold unit attributed to the predefined panel type. |
| Profit % | The percentage of profits attributed to the predefined panel type. Requires notification on product cost. |
| Profit | The profit attributed to the predefined panel type. Requires notification on product cost. |
| Profit/Sold unit | The profit per sold unit attributed to the predefined panel type. Requires notification on product cost. |
| Profit margin | The profit margin attributed to the predefined panel type. Requires notification on product cost. |
The panel summary report can be exported and downloaded as a .csv-file.